Monitoring Materialization
Materialization jobs orchestrated by Tecton can be monitored and debugged using the Tecton Web UI, SDK, and CLI in case of failures.
Retry Strategy for Failing Jobs
Tecton will automatically retry failing jobs with different policies based on the failure:
- Failures due to expected reasons such as an AWS spot instances being reclaimed are retried immediately.
- Otherwise, the job will be retried after 5 minutes, with exponential backoff for each successive failure.
Jobs that will be retried are shown in the Web UI as Retrying (in X minutes).
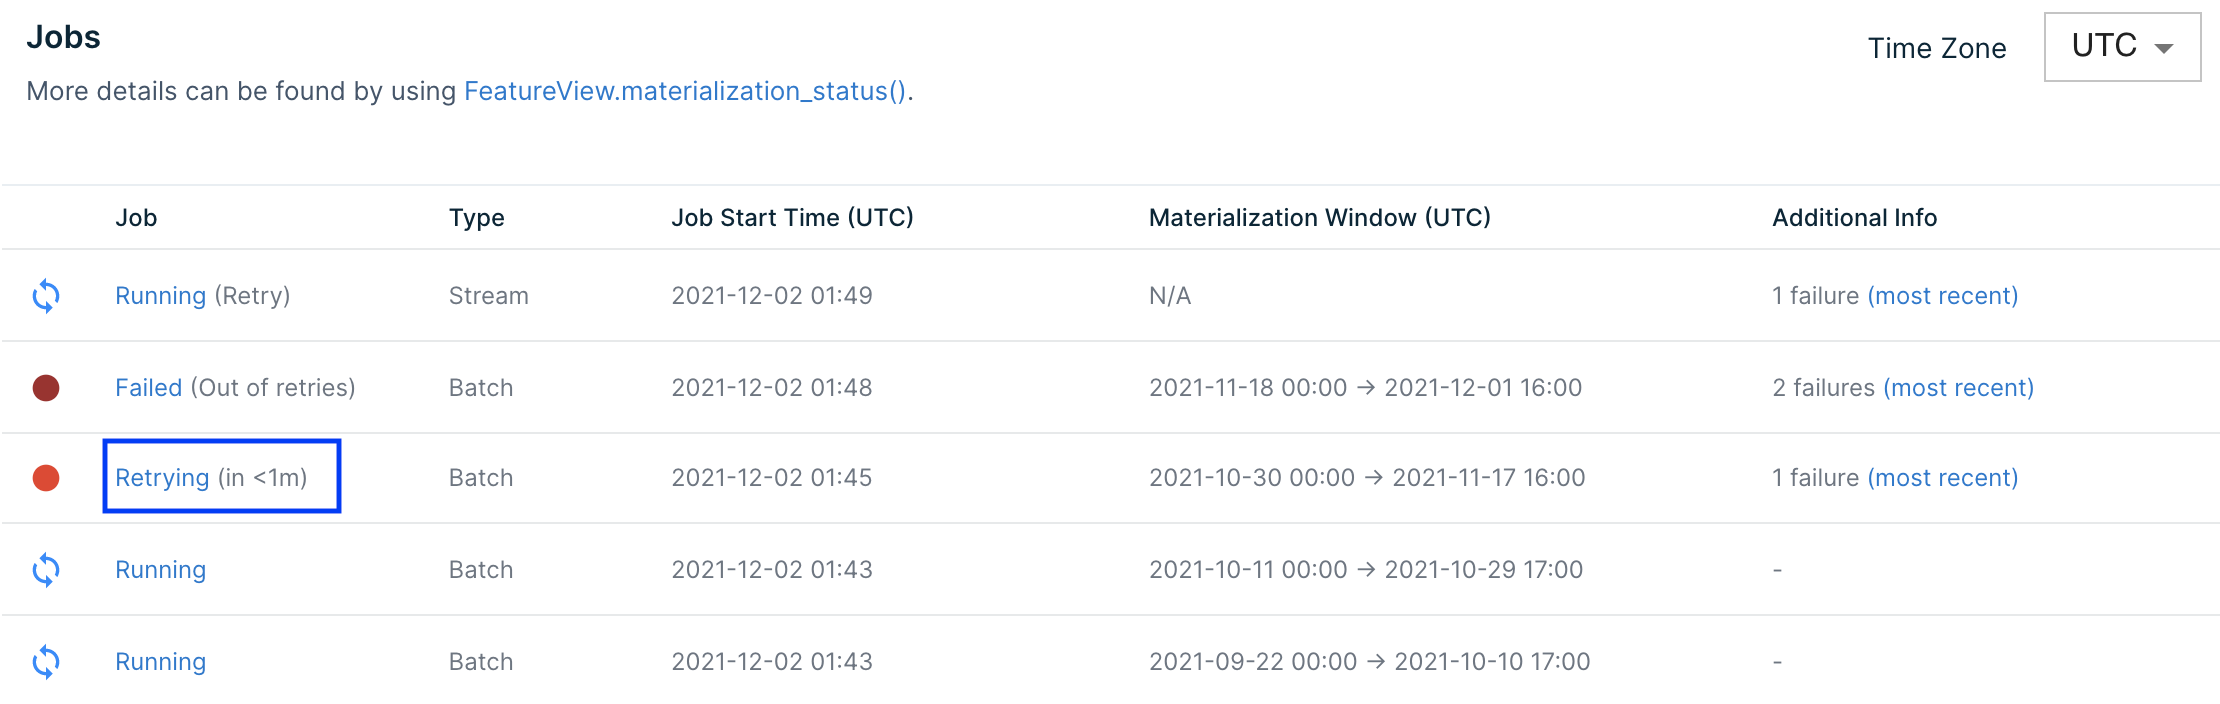
If a job fails too many times, auto-retries will stop and jobs will be labeled
Failed in the Web UI. This happens after 100 attempts for spot
instance-related failures or 10 attempts for other failures.
Retrying Failed Jobs
Materialized Jobs that fail repeatedly will eventually stop retrying. At this
stage they can be manually retried. When you are ready to retry the failed job
(e.g. after fixing the cause of the failures), trigger a manual retry of the job
by clicking the Retry button in the Actions column of the failed job:

A notification will appear when the retry has been successfully scheduled. This
happens immediately: 
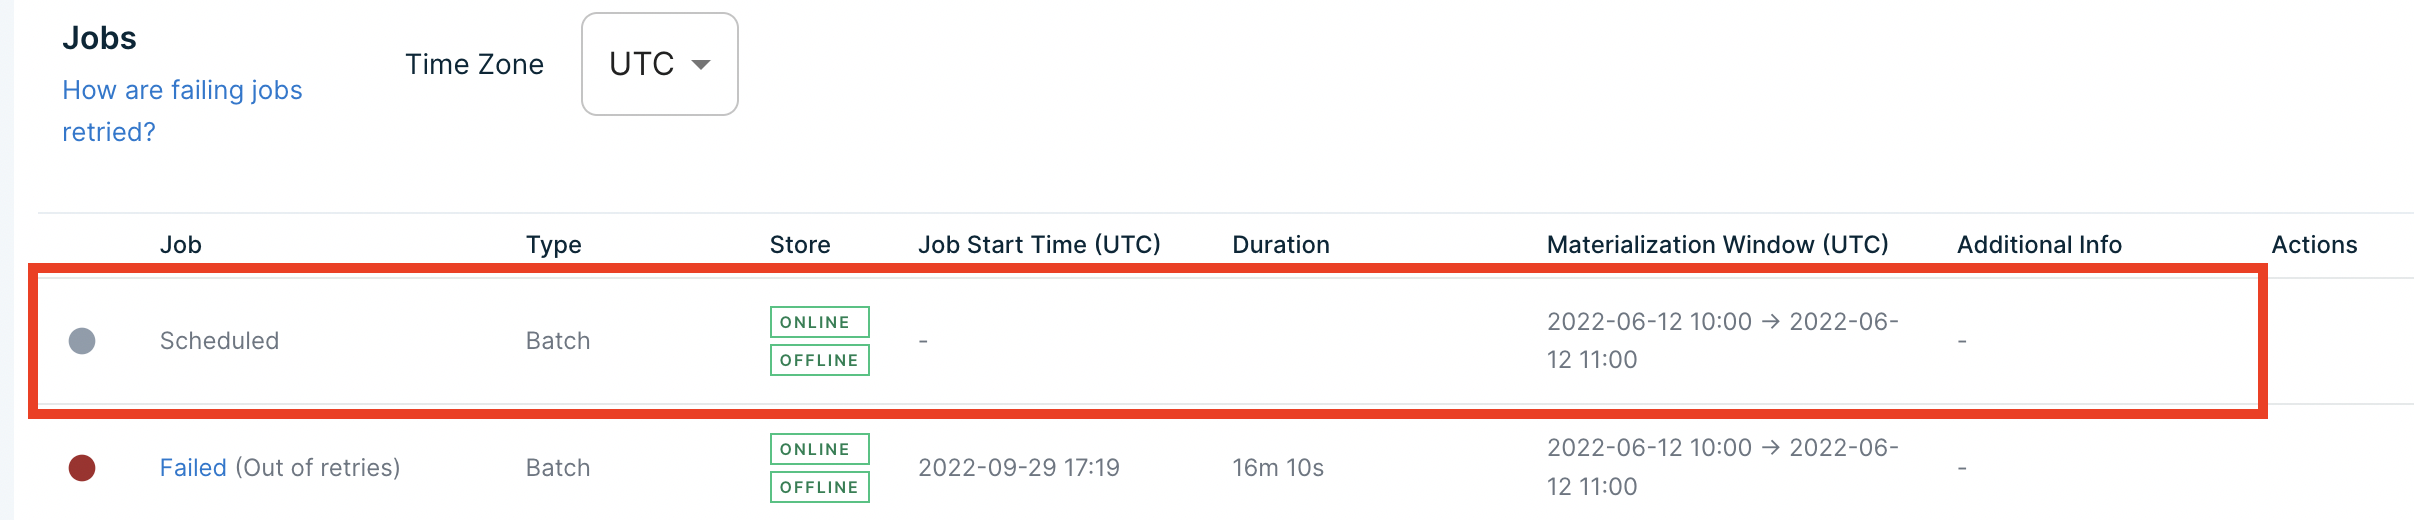
A retry job gets scheduled immediately:
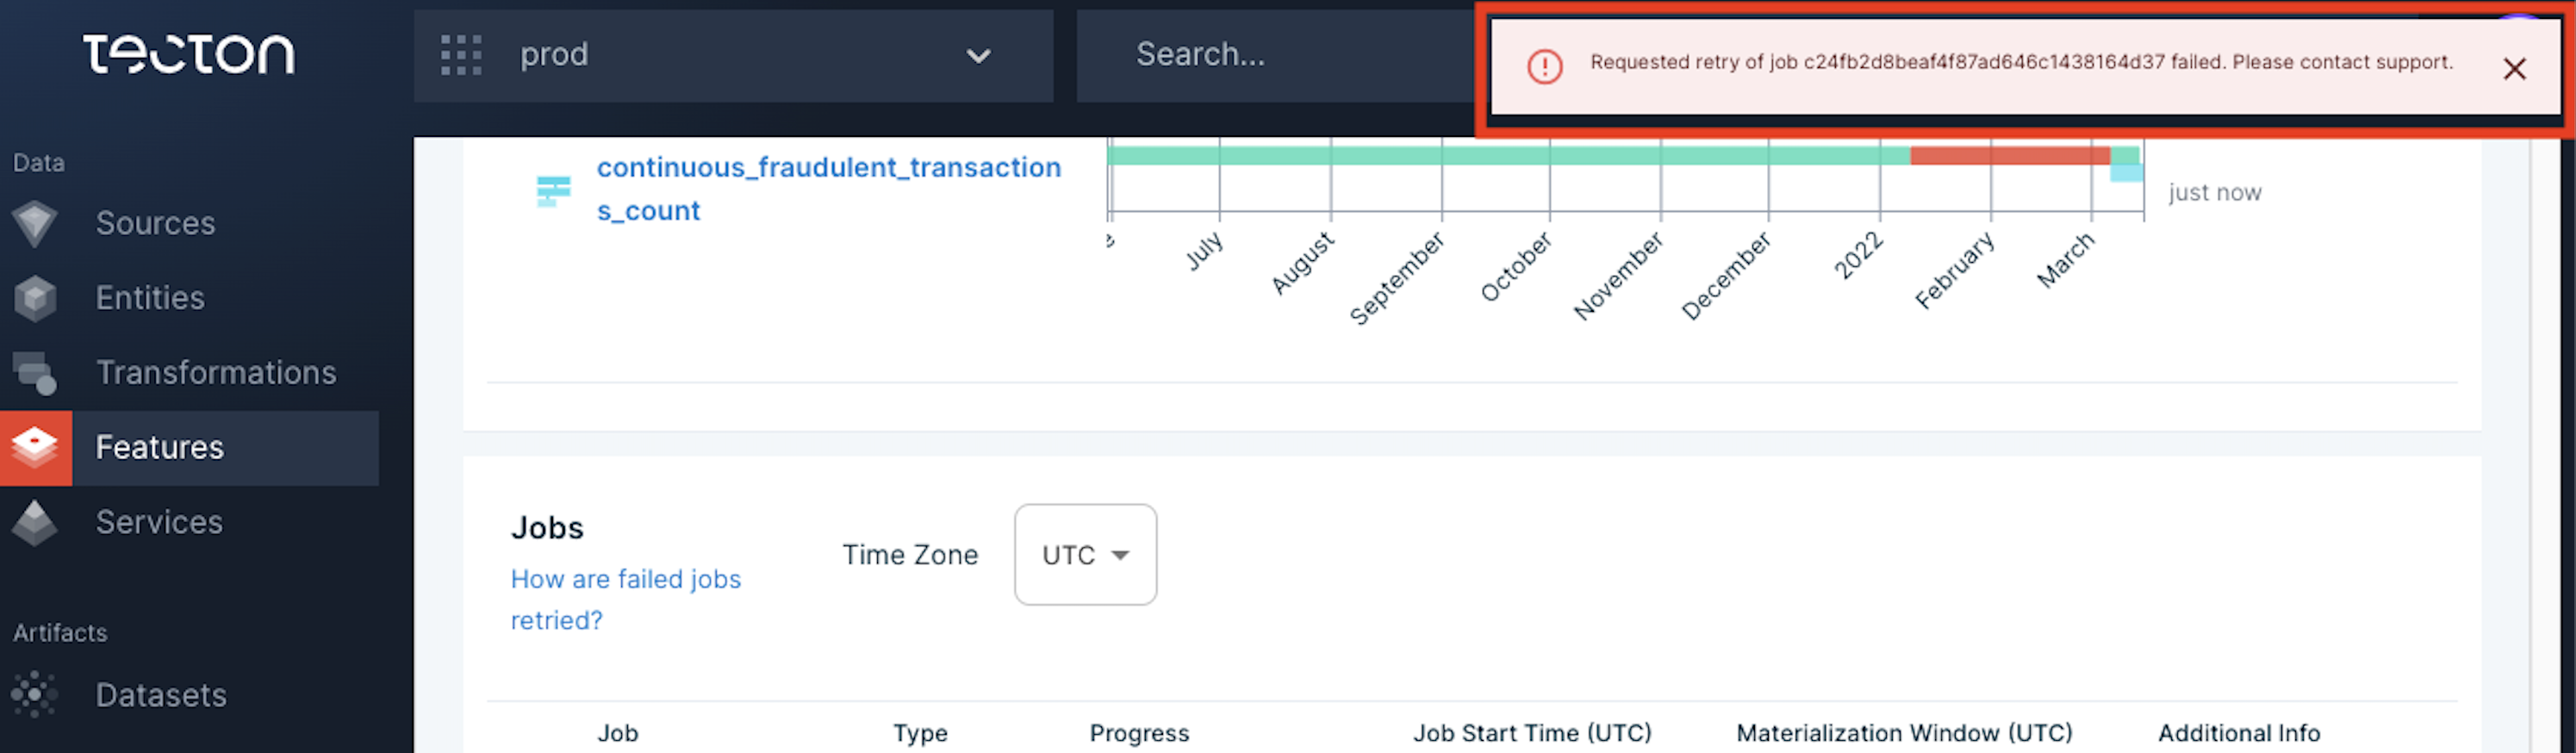
If the scheduling of the retry fails, the notification will give you a job ID,
and you can contact support with the message:
Re-running Successful Jobs
Although a materialization job may have succeeded, you may run into scenarios where you need to re-run a specific time range for your feature view.
When re-running a materialization job that completed successfully, it’s possible to produce incorrect results in the Online Store. However, this operation is generally safe if one of the following are true:
Your previous job completed and did not output any feature data; or
Your Feature View is only materialized offline. (The Feature View is configured with
offline=Trueandonline=False).
If you are unsure of the impact of re-running a materialization job that completed successfully, please contact Tecton Support before proceeding.
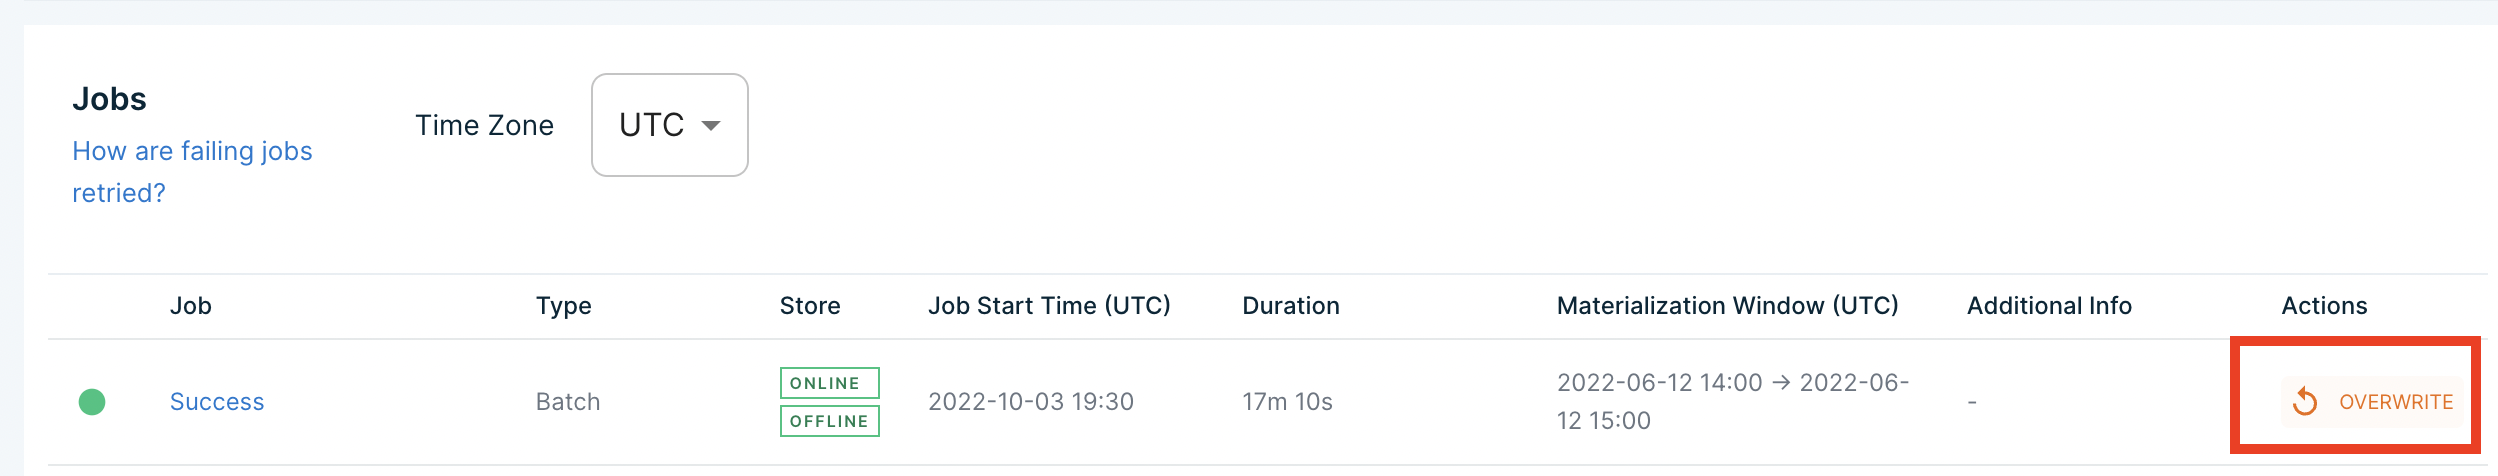
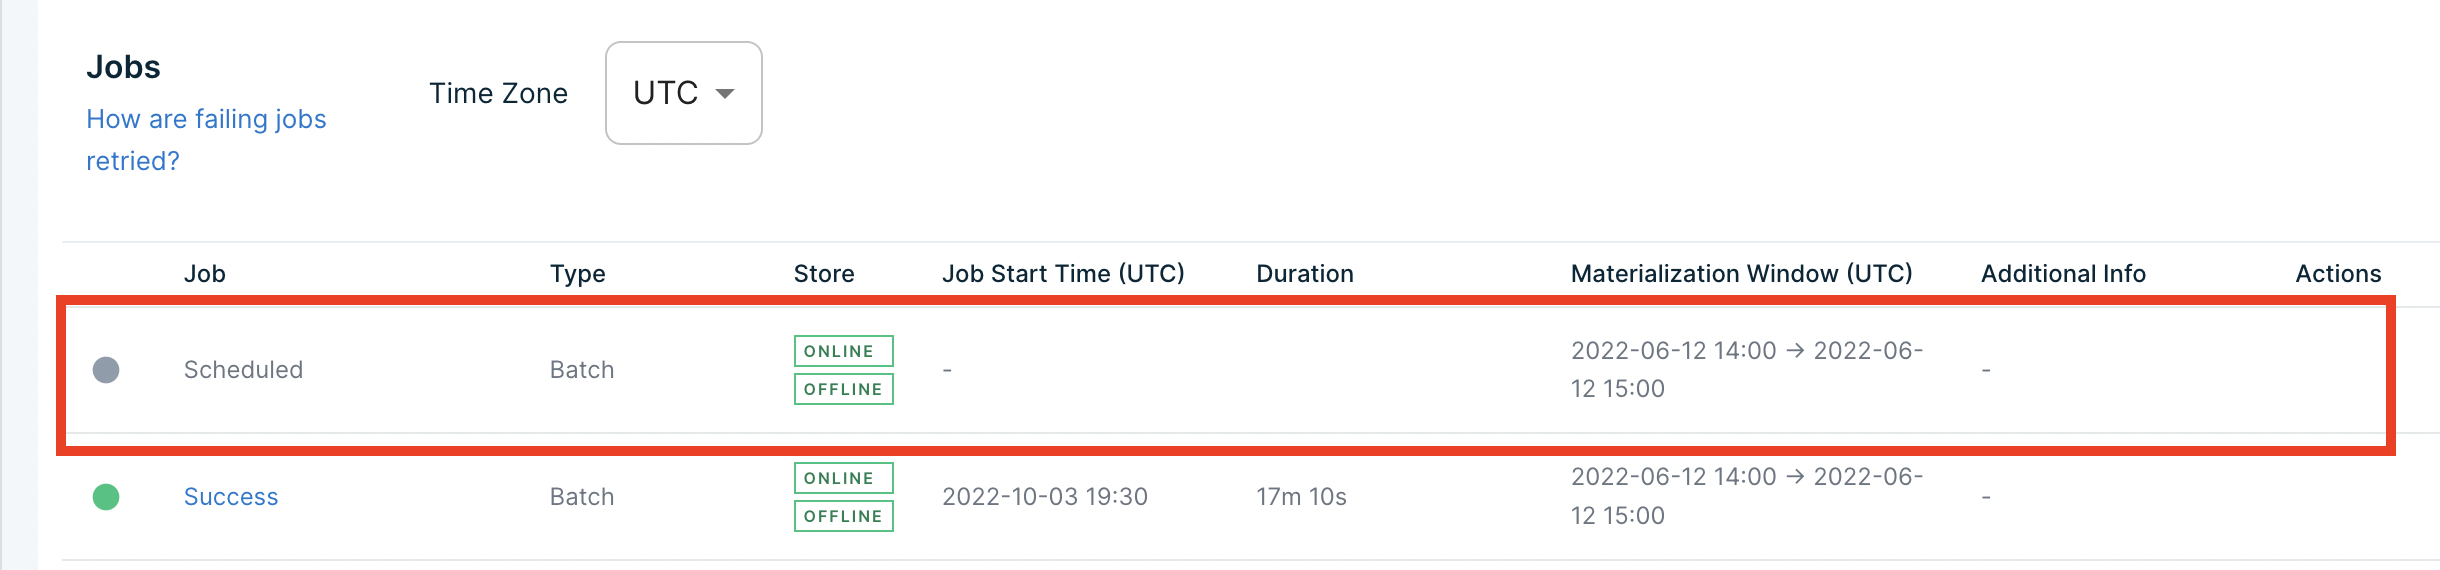
Trigger a re-run of the job by clicking the Overwrite button in the Actions
column of the Success job:
A re-run job gets scheduled immediately:
Cancelling Running Jobs
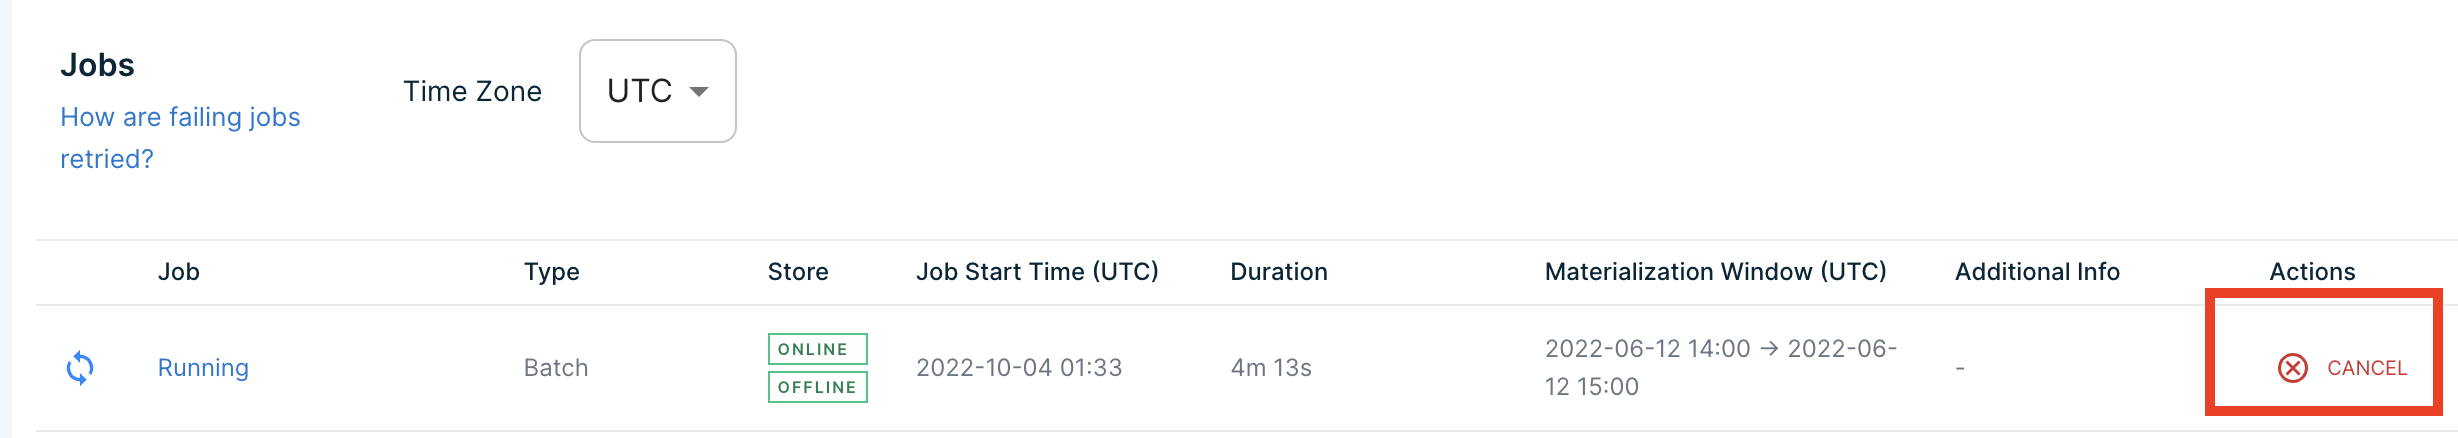
You may cancel a Running job or a job that's been continuously retrying by
clicking the Cancel button in the Actions column of the job.
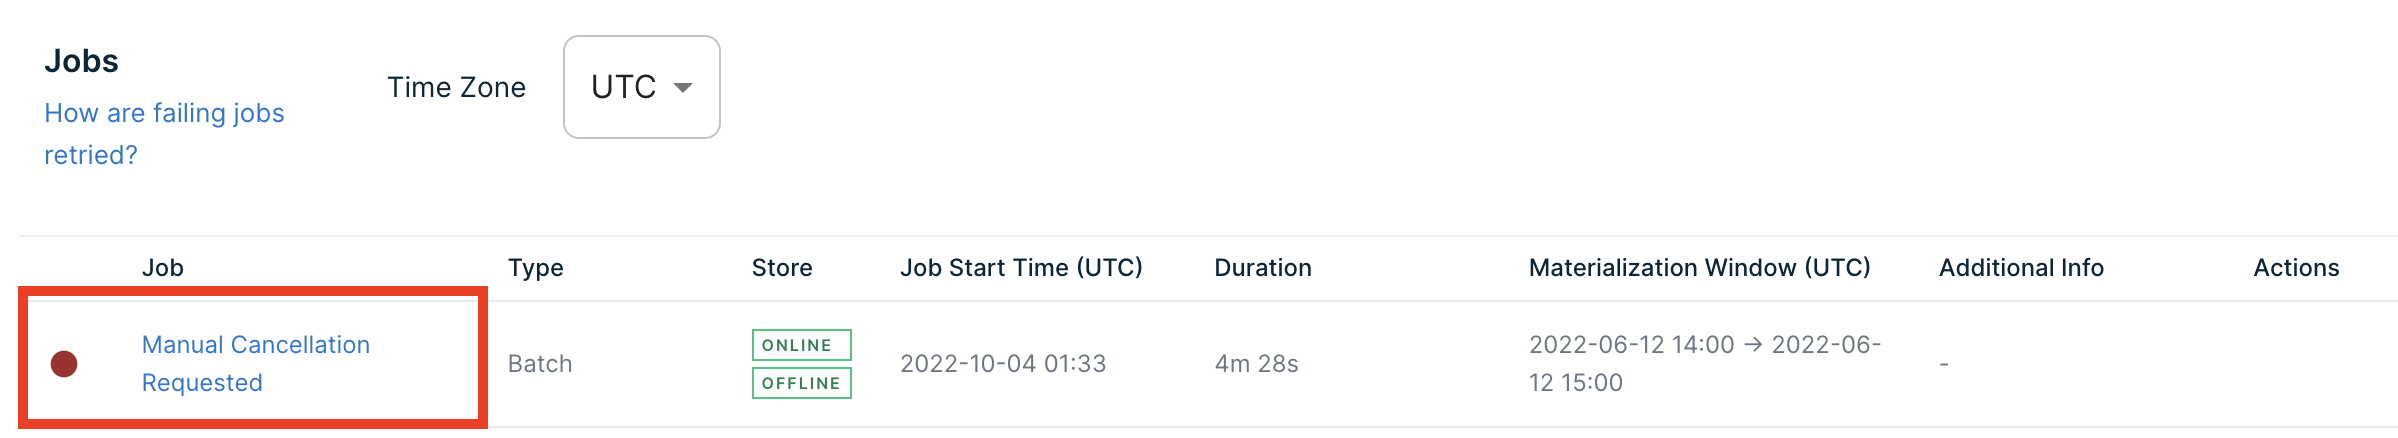
The job gets marked Manual Cancellation Requested immediately:
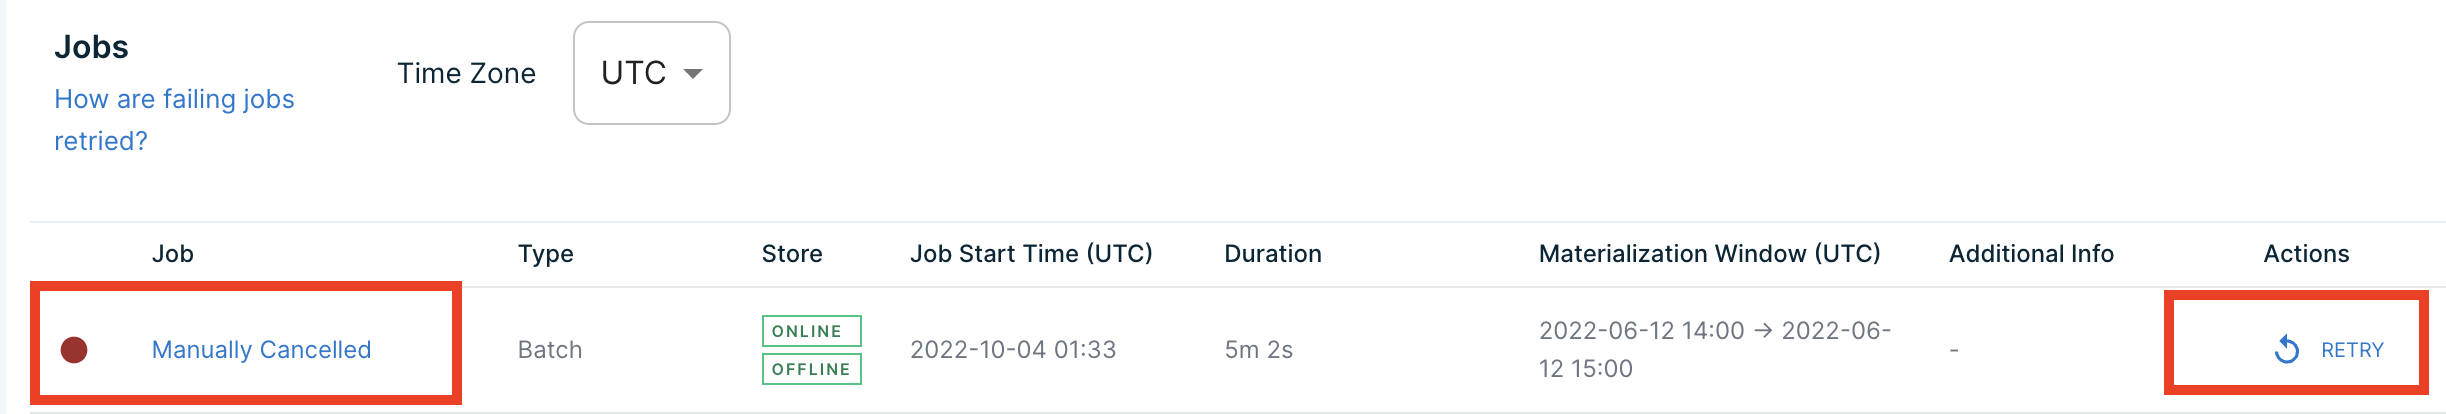
Within minutes the jobs will transition to Manually Cancelled. You may need to
refresh the page to see this change. At this point, you will have the option to
manually Retry the job.
Monitoring Failures
Tecton provides tools to monitor and debug materialized Feature Views from Tecton's Web UI, SDK, and CLI.
Web UI: Materialization Tab
The easiest way to check the health of a materialized Feature View is using the Web UI. Navigate to the Feature View in the Web UI and select the Materialization tab to see Feature View materialization information at a glance.
SDK: materialization_status()
Tecton's SDK provides a
materialization_status()
method on Feature View objects that returns details about materialization
attempts.
import tecton

fv = tecton.get_workspace("my_space").get_feature_view("my_fv")
fv.materialization_status()
>>> All the displayed times are in UTC time zone
TYPE     WINDOW_START_TIME      WINDOW_END_TIME     STATUS    ATTEMPT_NUMBER     JOB_CREATED_AT      JOB_LOGS
================================================================================================================
BATCH   2021-12-15 00:00:00   2021-12-22 00:00:00   SUCCESS         1          2021-12-22 00:00:27   https://...
BATCH   2021-12-14 00:00:00   2021-12-21 00:00:00   SUCCESS         1          2021-12-21 00:00:14   https://...
BATCH   2021-12-13 00:00:00   2021-12-20 00:00:00   SUCCESS         1          2021-12-20 00:00:13   https://...
BATCH   2021-12-12 00:00:00   2021-12-19 00:00:00   SUCCESS         1          2021-12-19 00:00:10   https://...
BATCH   2021-12-11 00:00:00   2021-12-18 00:00:00   SUCCESS         1          2021-12-18 00:00:06   https://...
CLI: materialization-status
You can also use the tecton materialization-status $FV_NAME to see the
materialization status of a specific Feature View.
$ tecton materialization-status my_feature_view
All the displayed times are in UTC time zone
TYPE     WINDOW_START_TIME      WINDOW_END_TIME     STATUS    ATTEMPT_NUMBER     JOB_CREATED_AT      JOB_LOGS
================================================================================================================
BATCH   2021-12-15 00:00:00   2021-12-22 00:00:00   SUCCESS         1          2021-12-22 00:00:27   https://...
BATCH   2021-12-14 00:00:00   2021-12-21 00:00:00   SUCCESS         1          2021-12-21 00:00:14   https://...
BATCH   2021-12-13 00:00:00   2021-12-20 00:00:00   SUCCESS         1          2021-12-20 00:00:13   https://...
BATCH   2021-12-12 00:00:00   2021-12-19 00:00:00   SUCCESS         1          2021-12-19 00:00:10   https://...
BATCH   2021-12-11 00:00:00   2021-12-18 00:00:00   SUCCESS         1          2021-12-18 00:00:06   https://...
Monitoring Feature Freshness
Feature Views can serve stale data for many reasons such as failed materialization jobs, late-arriving data, and under-provisioned streams. Feature freshness can be monitored using the Web UI.
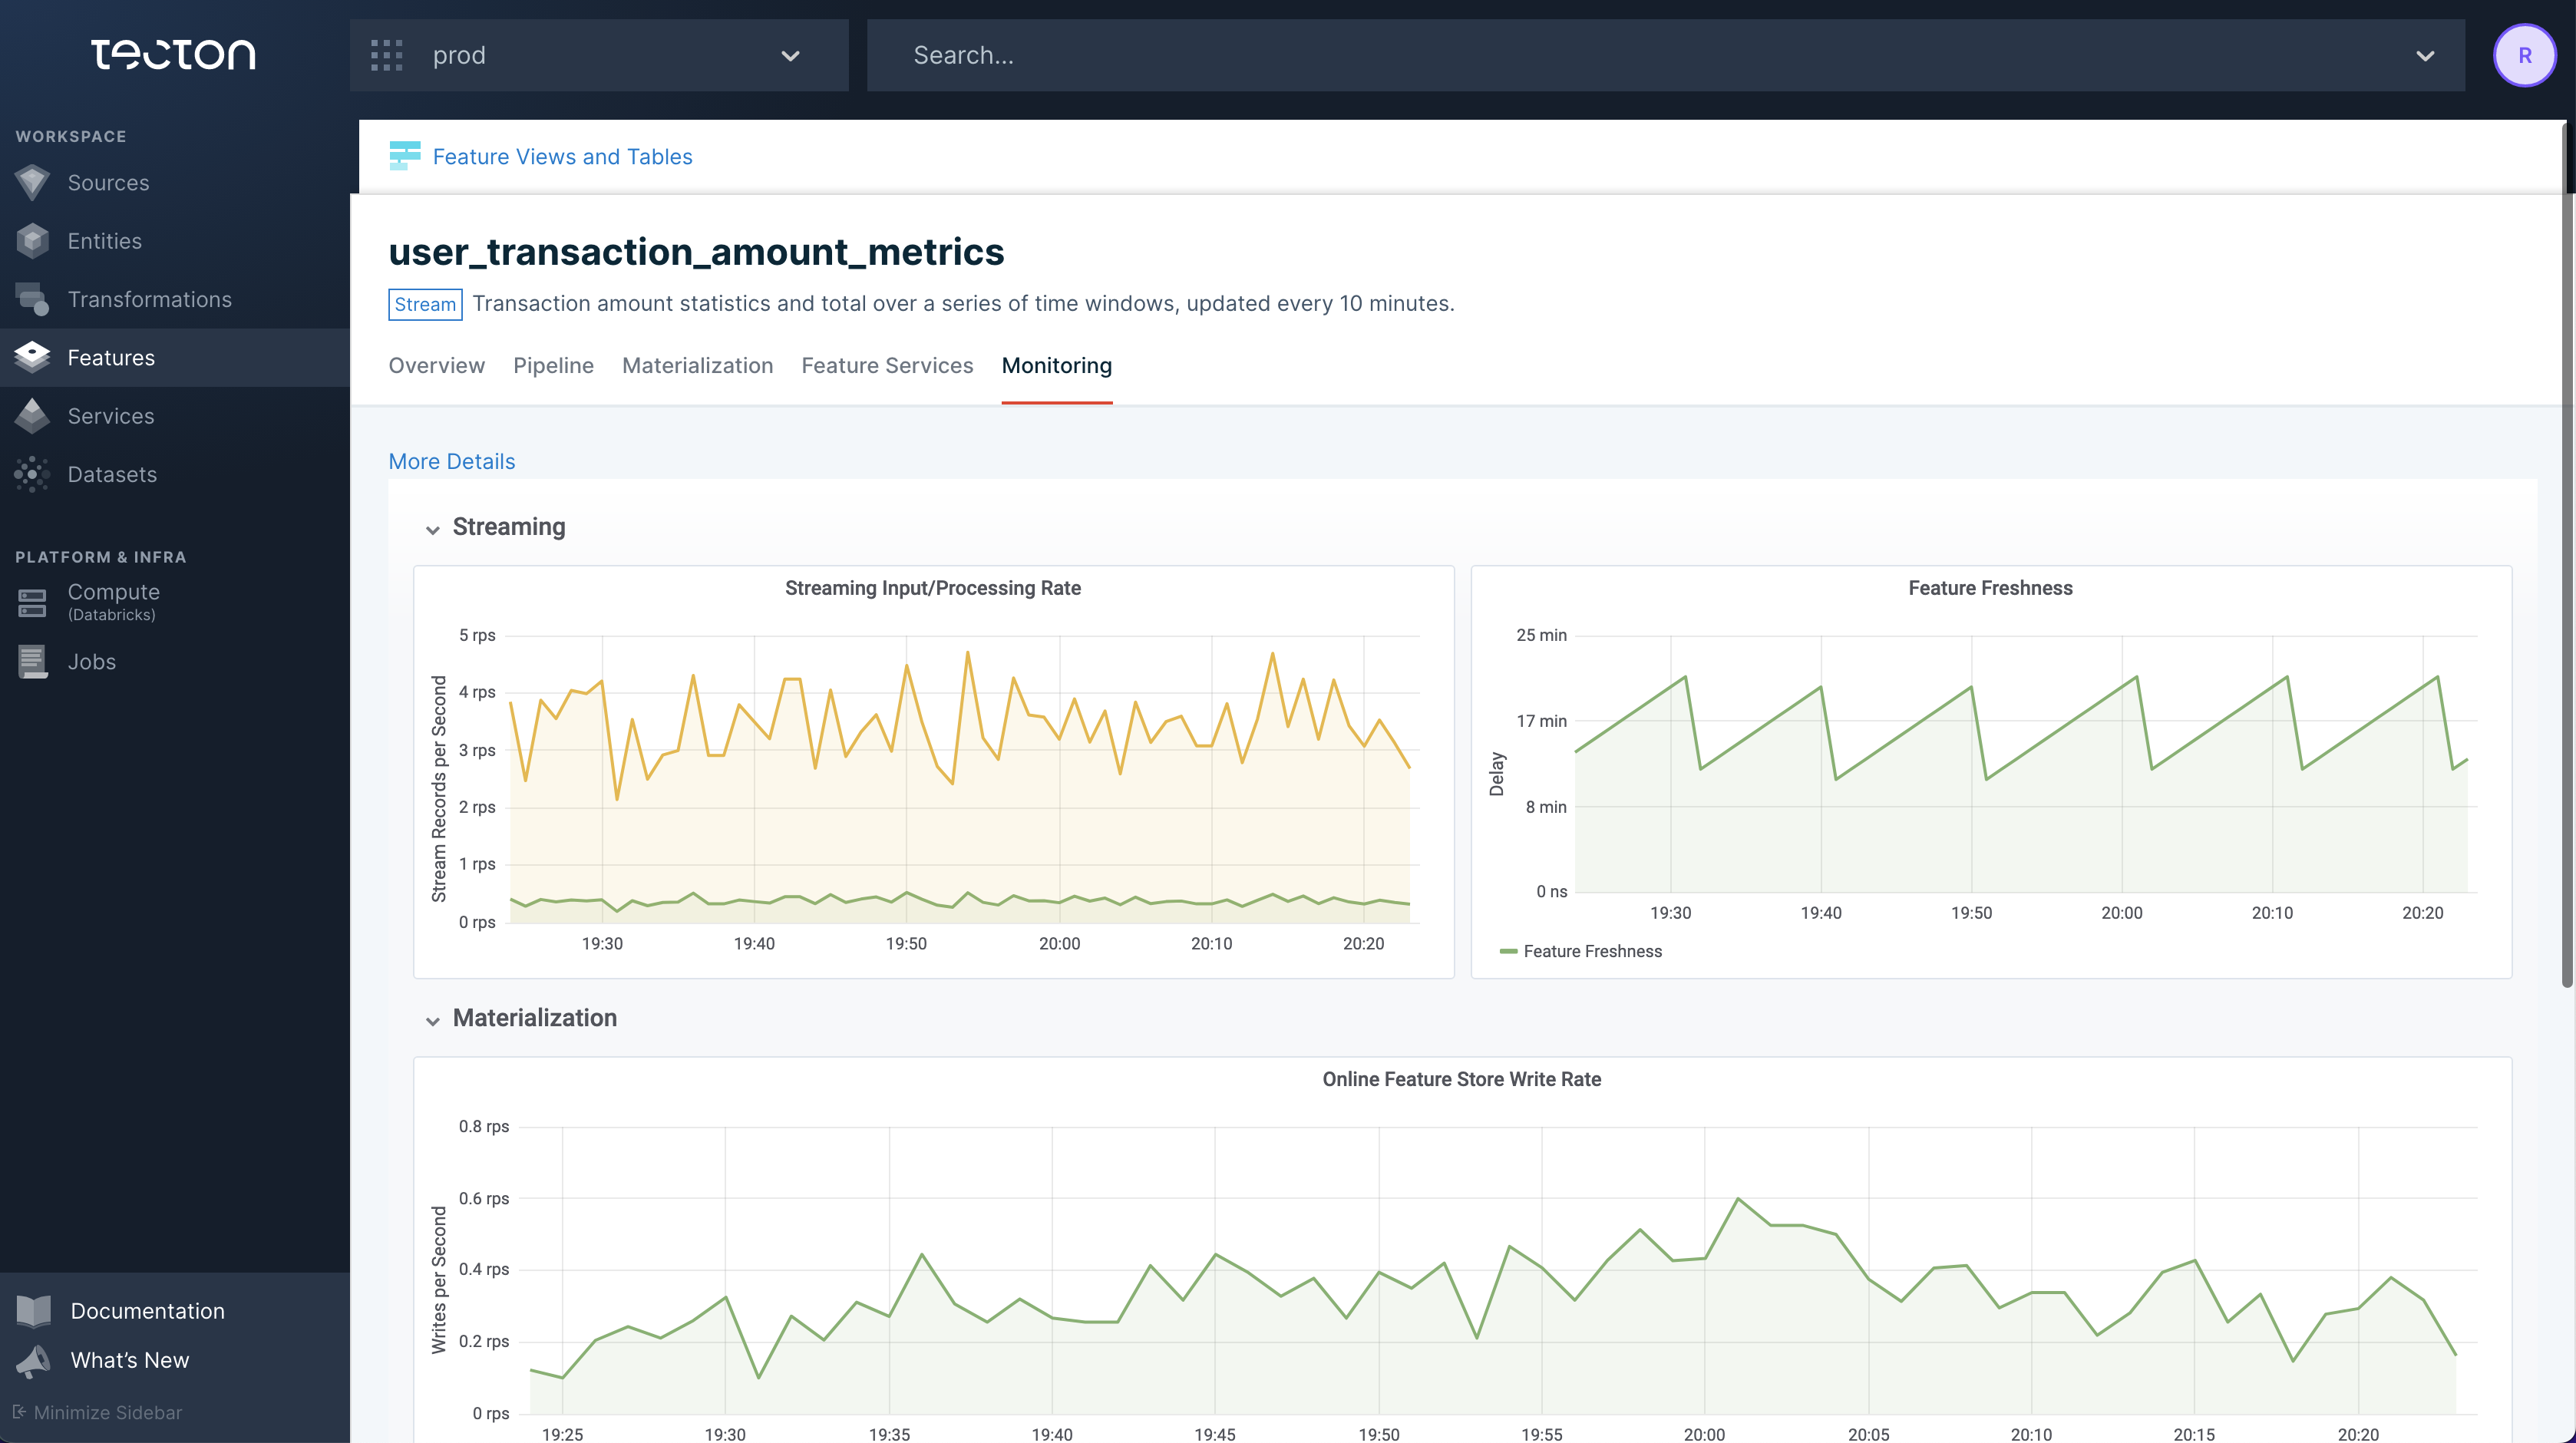
Web UI: Monitoring tab
The Monitoring tab for a Feature view contains freshness monitoring charts for any Feature View with materialization enabled.
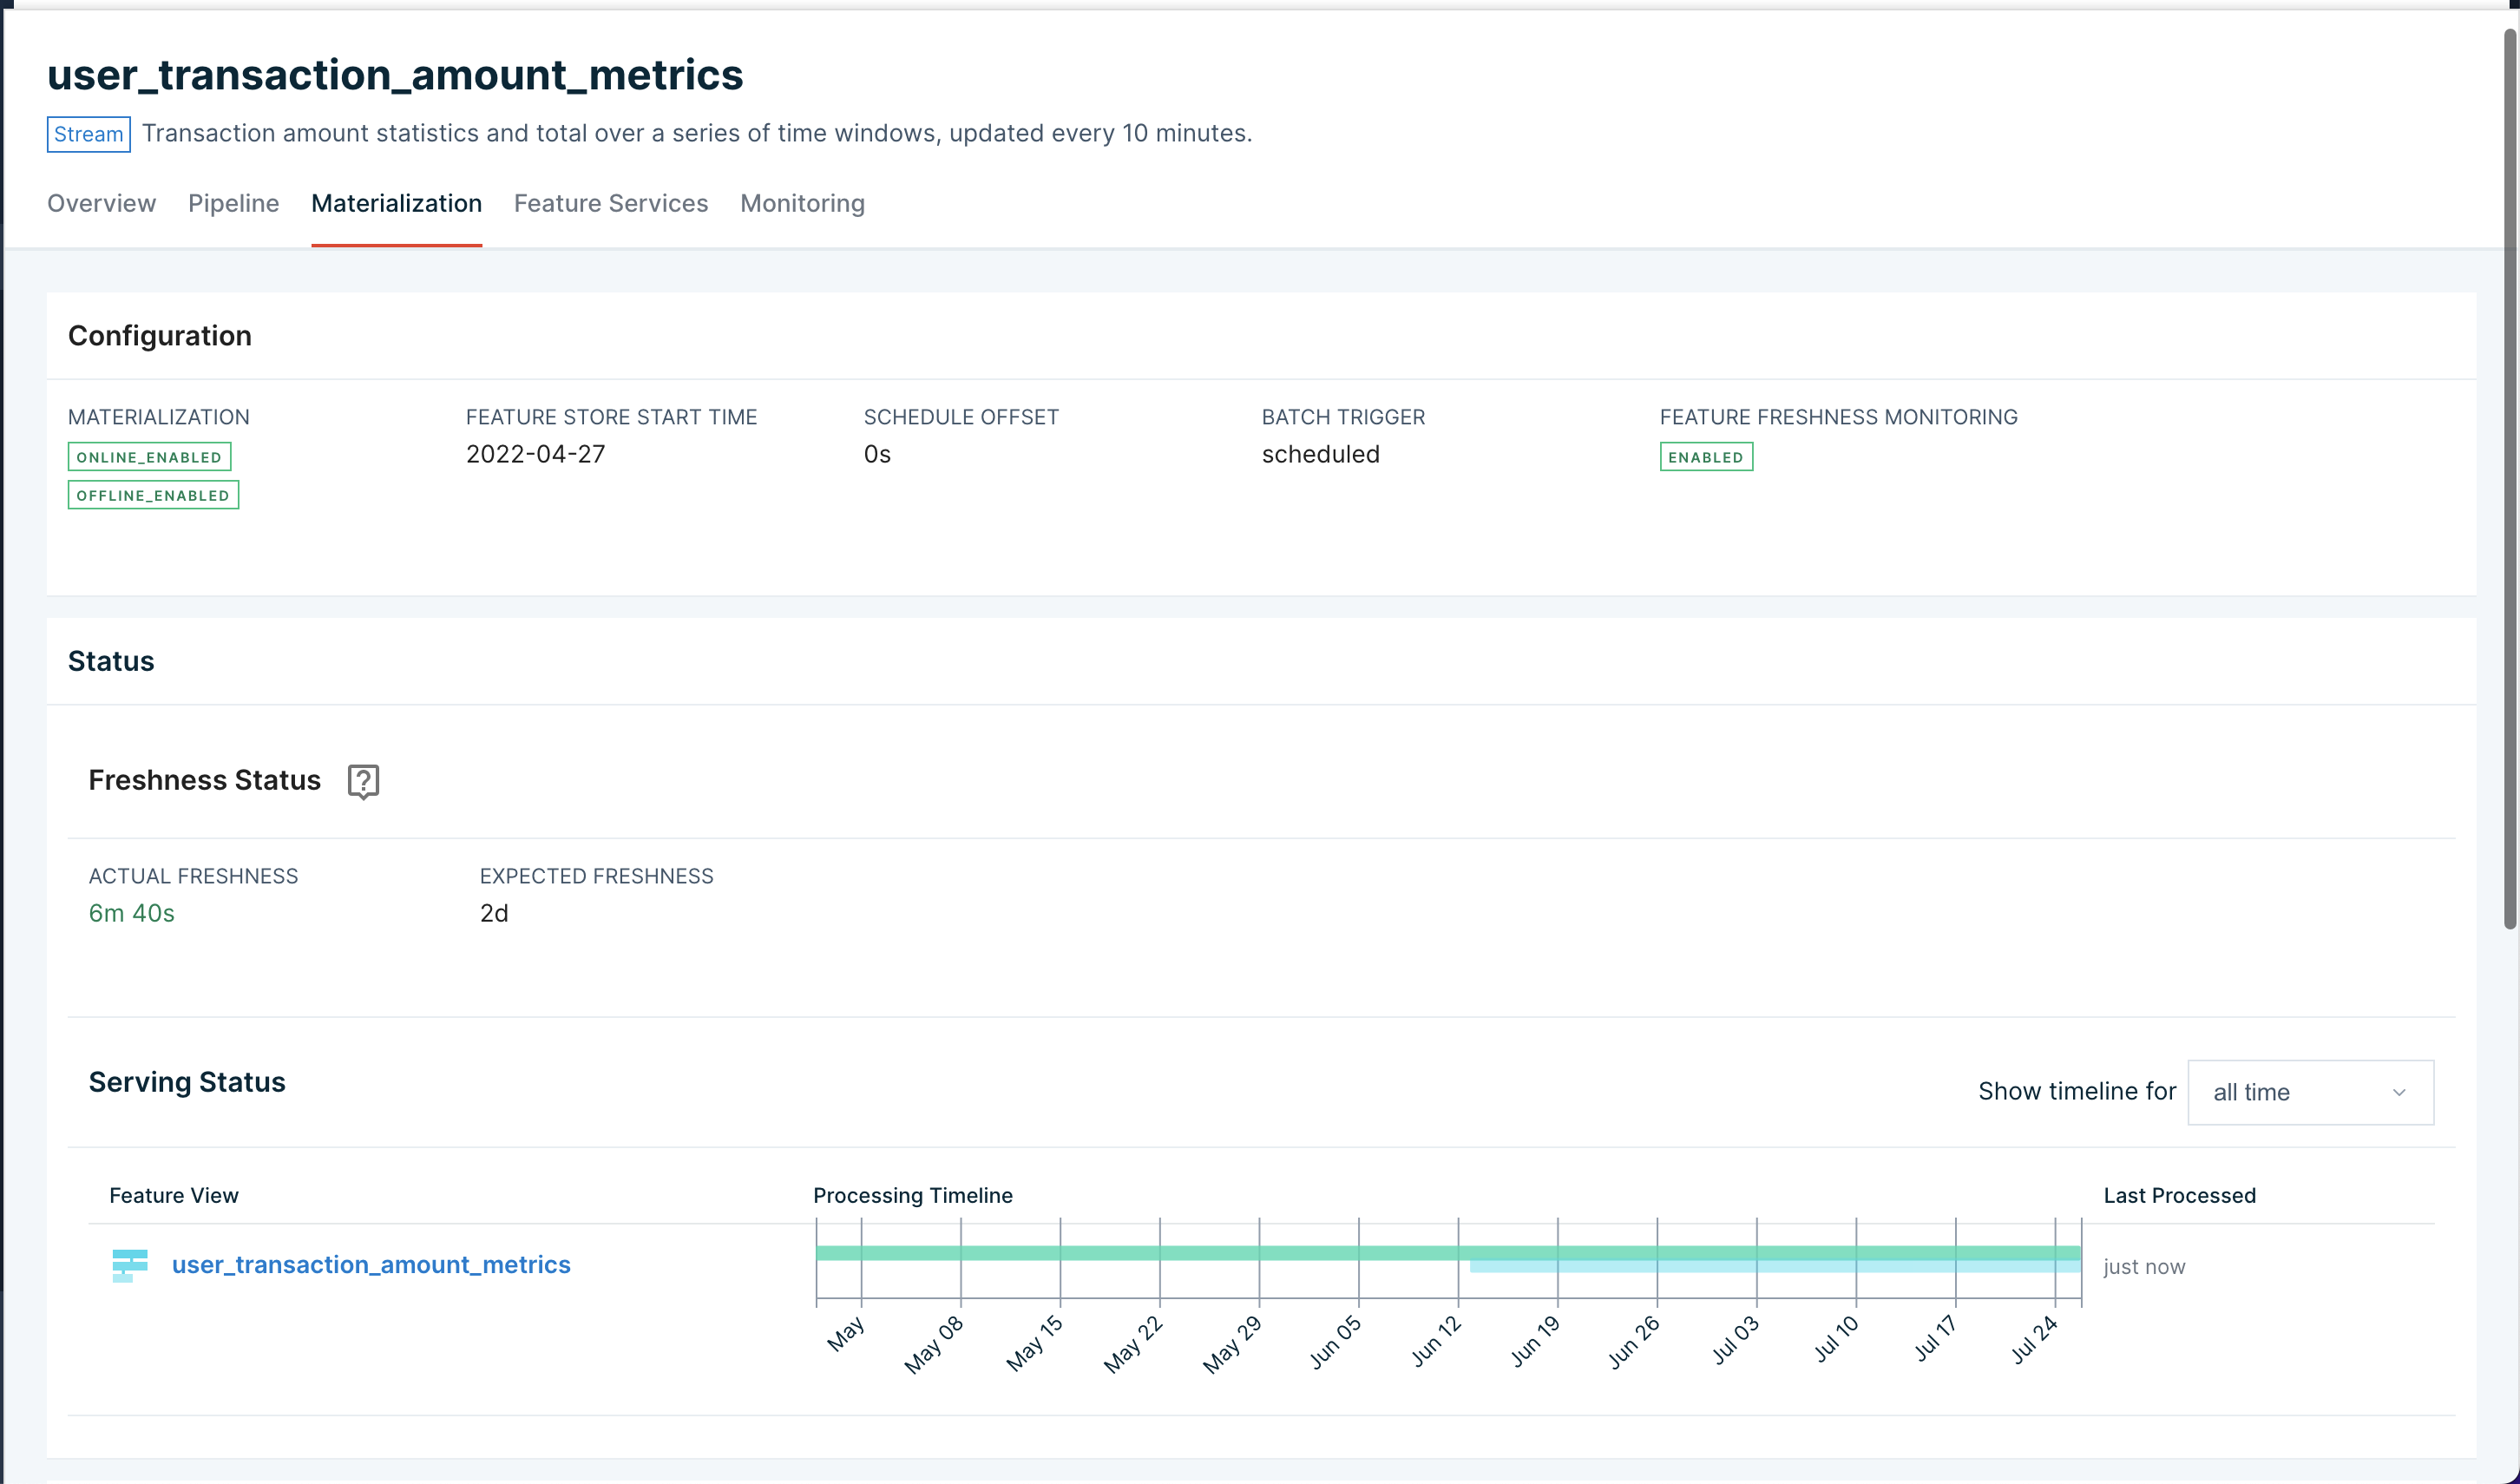
Web UI: Materialization tab
The Materialization tab for a Feature View contains information about expected and actual freshness for a Feature View along with a materialization timeline.
CLI: tecton freshness for all Feature Views
Tecton's CLI can return the status of all Feature Views using the
tecton freshness command.
$ tecton freshness
           Feature View               Stale?   Freshness   Expected Freshness     Created At
=================================================================================================
partner_ctr_performance:14d              Y        2wk 1d      2d                   12/02/21 10:52
ad_group_ctr_performance                 N        1h 1m       2h                   11/28/21 19:50
user_ad_impression_counts                N        1m 35s      2h                   10/01/21 2:16
content_keyword_ctr_performance:v2       N        1m 36s      2h                   09/04/21 22:22
content_keyword_ctr_performance          N        1m 37s      2h                   08/26/21 12:52
user_total_ad_frequency_counts           N        1m 38s      2h                   08/26/21 12:52
Expected Feature Freshness
A Feature Views's freshness is expected to be less than twice its
materialization schedule interval. This interval is determined using the
aggregation_interval for Window Aggregate Feature Views or the
batch_schedule for other Feature Views.
By default, alerts will fire once this threshold, plus a small grace period, is crossed. For streaming Feature Views, freshness can be configured as low as 30 minutes. The grace period's duration depends on the FeatureView's materialization schedule:
| Schedule | Grace Period |
|---|---|
| <= 10 minutes | 30 minutes |
| <= 30 minutes | 90 minutes |
| <= 1 hour | 2 hours |
| <= 4 hours | 4 hours |
| <= 24 hours | 12 hours |
| > 24 hours | 24 hours |
The table below has examples of materialization schedules mapped to default alert thresholds:
| Schedule | Default Alert Threshold |
|---|---|
| 5 minutes | 40 minutes |
| 30 minutes | 2.5 hours |
| 1 hour | 4 hours |
| 4 hours | 12 hours |
| 24 hours | 60 hours |